Are you a fishing enthusiast looking to improve your success rate? Understanding the impact of water temperature on fish behavior can be a game changer. In this article, we’ll explore how to use a fishing temperature chart and provide expert tips and techniques.
Understanding Water Temperature and Fishing
Firstly, let’s discuss why water temperature matters for fishing. Fish are cold-blooded creatures, which means their body temperature is determined by their environment. Therefore, water temperature directly affects their metabolism, feeding patterns, and overall behavior.
Why Water Temperature Matters
Using a temperature chart can help you determine the best time to fish for a particular species. For example, if you’re targeting trout, you’ll want to look for water temperatures between 50°F and 65°F. If you’re after bass, you’ll have more luck in water temperatures between 60°F and 75°F.
How to Use a Water Temperature Chart
But how do you use a temperature chart? The first step is to measure the water temperature using a thermometer. A fishing thermometer is a simple small pen-shaped waterproof device that you can place in the water to get an accurate temperature reading. It’s important to note that water temperature does change depending on how big and deep the water is or the depth of the fish you’re after.
Next, consult the chart to see which temperature range is optimal for your target species. It’s also worth noting that some species may have different preferences depending on the time of day or season.
Best Water Temperature Ranges for Popular Fish Species
Here are some key temperature ranges for popular fish species:
Trout Fishing Water Temperature Chart (sweet spot is between 50°F-65°F)
Trout Species Water Temperature Range Brook Trout 45°F – 60°F Brown Trout 50°F – 65°F Rainbow Trout 55°F – 70°F Bass Fishing Water Temperature Chart (sweet spot is between 60°F – 70°F)
Bass Species Water Temperature Range Largemouth Bass 60°F – 75°F Smallmouth Bass 65°F – 75°F Spotted Bass 60°F – 75°F Salmon Fishing Water Temperature Chart (sweet spot is between 50°F – 60°F)
Salmon Species Water Temperature Range Chinook Salmon 50°F – 55°F Coho Salmon 50°F – 60°F Sockeye Salmon 55°F – 60°F Crappie Fishing Water Temperature Chart (55°F – 65°F)
Crappie Species Water Temperature Range Black Crappie 55°F – 65°F White Crappie 65°F – 75°F Catfish Fishing Water Temperature Chart (70°F – 85°F)
Catfish Species Water Temperature Range Blue Catfish 70°F – 85°F Channel Catfish 70°F – 80°F Flathead Catfish 75°F – 85°F Walleye Fishing Water Temperature Chart (55°F – 70°F)
Walleye Species Water Temperature Range Yellow Walleye 55°F – 70°F Blue Walleye 60°F – 65°F Panfish Fishing Water Temperature Chart (65°F – 75°F)
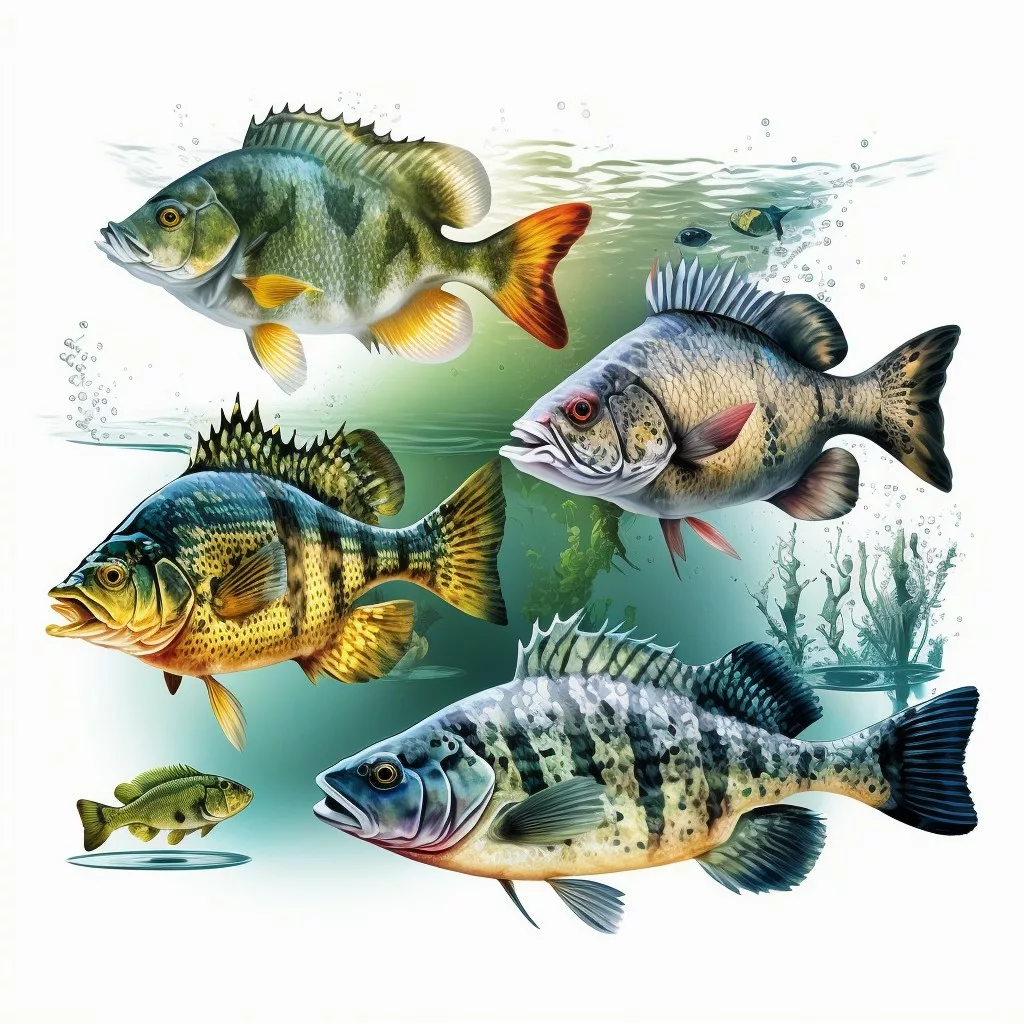
Panfish Species Water Temperature Range Bluegill 65°F – 75°F Crappie 55°F – 65°F Perch 55°F – 65°F Sunfish 65°F – 75°F
Of course, water temperature isn’t the only factor to consider when fishing. Other variables like water depth, weather conditions, and bait choice can also impact your success. However, by using a water temperature chart as a starting point, you’ll be able to make more informed decisions about when and where to fish.
In conclusion, using a water temperature chart for fishing can be a valuable tool for any angler. By understanding how water temperature affects fish behavior and using the appropriate temperature ranges for your target species, you can increase your chances of a successful day on the water.